Freemium
YouTube SEO and growth assistant for creators ...
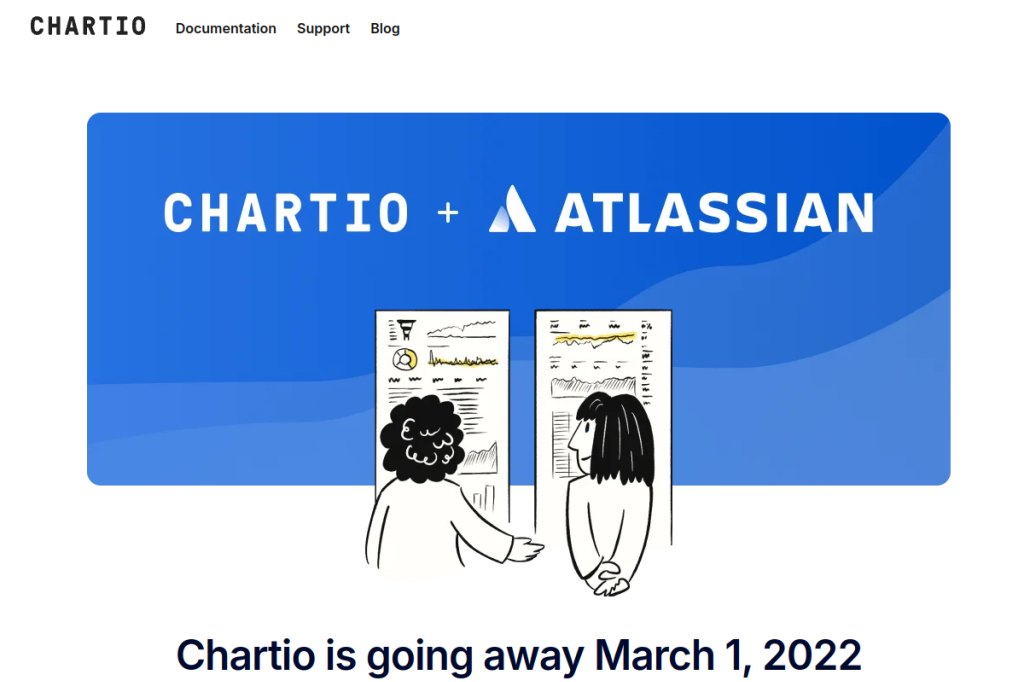
Chartio is a cloud-based data exploration and visualization platform combining an easy-to-use interface with AI capabilities to enable users to build interactive charts and dashboards from diverse data sources.
Designed for analysts, startups, and business users to quickly transform raw data into actionable insights without extensive coding knowledge, its AI integration assists in streamlining data preparation and suggesting optimal visualizations.
Key features include “Visual SQL,” which allows users to build queries visually, and a drag-and-drop interface for creating custom charts and dashboards.
Chartio supports data blending from multiple sources (databases, cloud apps, spreadsheets) and provides real-time data updates. By simplifying complex data queries and offering intuitive visualization tools, Chartio helps businesses understand their data quickly, identify trends, and monitor key performance indicators, fostering data-driven decision-making across organizations.
There are no reviews yet.
YouTube SEO and growth assistant for creators ...
Zoho Analytics is an AI-assisted reporting tool, suggesting visualization types based on data patterns, with Zia AI & What-If Analysis… ...
Zignal Labs is an AI media intelligence tool, with real-time issue detection across news/social media, with narrative tracking & impact… ...